 |
|
| |
 |
| |
|
| |
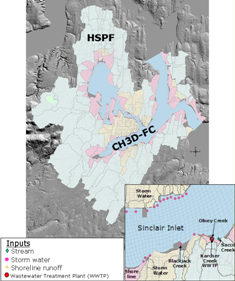
Integrated watershed
(HSPF) and receiving water (CH3D-FC) model developed to
simulate FC release, transport, and fate in Sinclair and
Dyes Inlets, Puget Sound, WA (larger
view). |
|
|
An integrated watershed and receiving water model was developed
to simulate fecal coliform (FC) fate and transport in Sinclair
and Dyes Inlets, Puget Sound, WA. The integrated model consisted
of a watershed model, an empirical FC loading model, and an
estuarine fate and transport model.
The watershed model, consisting of 15 Hydrologic Simulation
Program Fortran (HSPF) submodels, was deployed to simulate
watershed hydrology for streams (open channel flows), stormwater
catchments areas (piped flows), and shoreline drainage areas
(overland flows) for each drainage basin (DSN) within the watershed.
The empirical FC loading model developed from sampling data
gathered from the watershed was used to estimate FC concentrations
in surface streams and stormwater outfalls as a function of
upstream land use and land cover (LULC). Flow and FC concentrations
for discharges from waste water treatment plants (WWTP) were
estimated by interpolating data reported on monthly discharge
monitoring reports (DMRs) submitted by each facility.
The estuarine model, curvilinear hydrodynamics in three dimensions
(CH3D) previously calibrated to match the hydrodynamics of
the Inlets and modified to include FC kinetics (CH3D-FC), was
used to simulate the release, transport, and fate of FC loading
from watershed pour points corresponding to 39 stream mouths,
44 stormwater outfalls, 4 WWTP discharges, and 44 shoreline
drainage areas.
The output from HSPF was used as input
to CH3D-FC. The time-varying flows produced by HSPF for each
of the stream, stormwater, and shoreline pour points were used
to calculate the loads based on the loading concentration assigned
to each basin. The loads were read into CH3D-FC along with the
loads from the WWTPs to simulate the total FC loading for each
simulation scenario. The estuarine CH3D-FC model was run to
simulate the tides, circulation conditions, fresh water, and
FC inputs occurring during individual storm events (10 d) that
occured in 2004 and over the course of Water Year 2003 (WY2003)
from October 1, 2002 to September 30, 2003 (364 d).
A total of 20 simulation scenarios were
run to verify model performance, assess sensitivity and uncertainty,
and provide results needed to establish waste load and load
allocations for the Total Maximum Daily Load of FC loading in
Sinclair and Dyes Inlets. Model verification consisted of comparing
model predictions to observed data collected during three storm
events sampled in 2004 and observed data collected during WY2003.
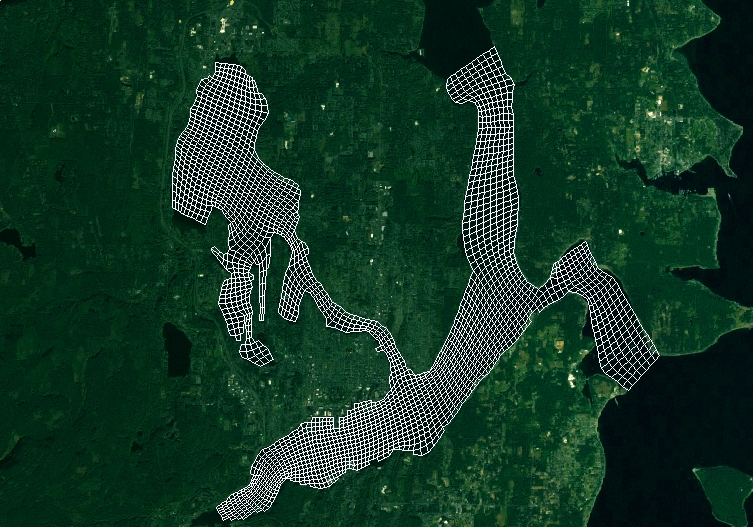
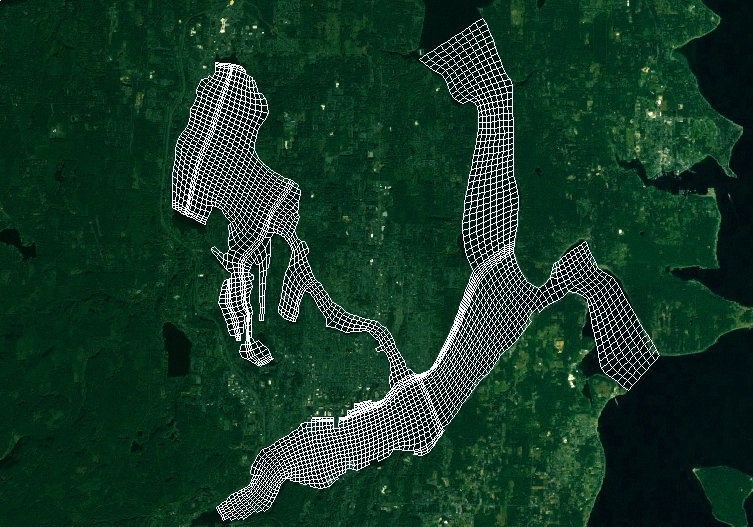
Note about grids:
CH3D
uses a curvilinear grid that is represented by Cartesian rows
and columns. The grid developed for Sinclair and Dyes Inlets
contains 91 rows and 96 columns (91x96
grid) with a resolution of about 100 – 150 m (300
– 450 ft). A higher resolution grid was developed to
reduce
“initial” dilution in areas of low flushing such
as the mouths of Clear, Chico, and Karcher Creeks, and other
areas including Oyster Bay, Ostrich Bay, Phinney Bay, and near
the Shipyard. This higher resolution grid has 94 rows and 105
columns (94x105 grid)
with
a resolution of about 30 – 50 m (100 – 150 ft)
in
those areas.
Suggested citation:
Johnston, R.K., Wang, P.F.,
Loy, E.C., Blake, A.C., Richter,
K.E., Brand, C.E. Kyburg, M.C, Skahill, B.E., May, C.W., Cullinan,
V., Choi,
W., Whitney, V.S., Leisle, D.E., and Beckwith, B. 2009. “An
Integrated Watershed and Receiving Water Model for Fecal Coliform
Fate and Transport in Sinclair and Dyes Inlets, Puget Sound,
WA.” Space and Naval Warfare Systems Center, Technical
Report 1977, Dec. 2, 2009. http://environ.spawar.navy.mil/Projects/ENVVEST/FC_Model_Report/
|

